Graphing Shelly temperatures into Grafana
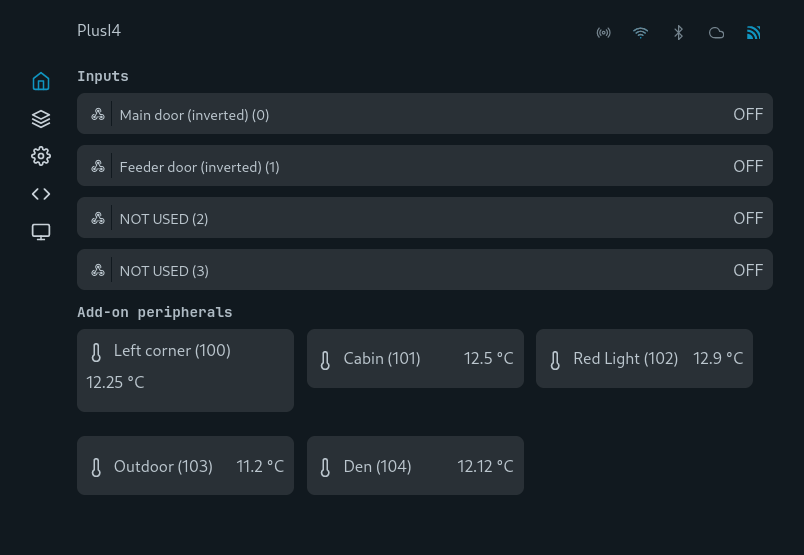
I own a Shelly i4 (DC model) that keeps an eye on two doors contacts (also knowns as reed switches), which I augmented with a Shelly Plus Addon that keeps an eye on five DS18B20 temperature sensors.
I use Homebridge so I can see the live state of doors and probes through the Homekit app on my phone.
The problem is Homekit won’t provide historical graphs. I’d like to know (for example) if temperature went below 0 degree.
I started looking into this and came up with this approach:
- Shelly reports info to a Mosquitto MQTT instance
- Telegraf listens to the MQTT topics and insert values into InfluxDB
- Grafana queries InfluxDB and generates graphs
I run everything as Docker containers.
MQTT
Start an instance:
docker run --name mqtt --restart always -d --net host -v /opt/docker/container/mqtt/mosquitto.conf:/mosquitto/config/mosquitto.conf -v /opt/docker/container/mqtt/data:/mosquitto/data -v /opt/docker/container/mqtt/log:/mosquitto/log eclipse-mosquitto
Bad practice but I allow anonymous connections to MQTT for any external devices. I have a dedicated network segment for devices with no access to the outside. This is the mosquitto.conf file:
listener 1883 0.0.0.0
allow_anonymous true
persistence true
persistence_location /mosquitto/data/
log_dest file /mosquitto/log/mosquitto.log
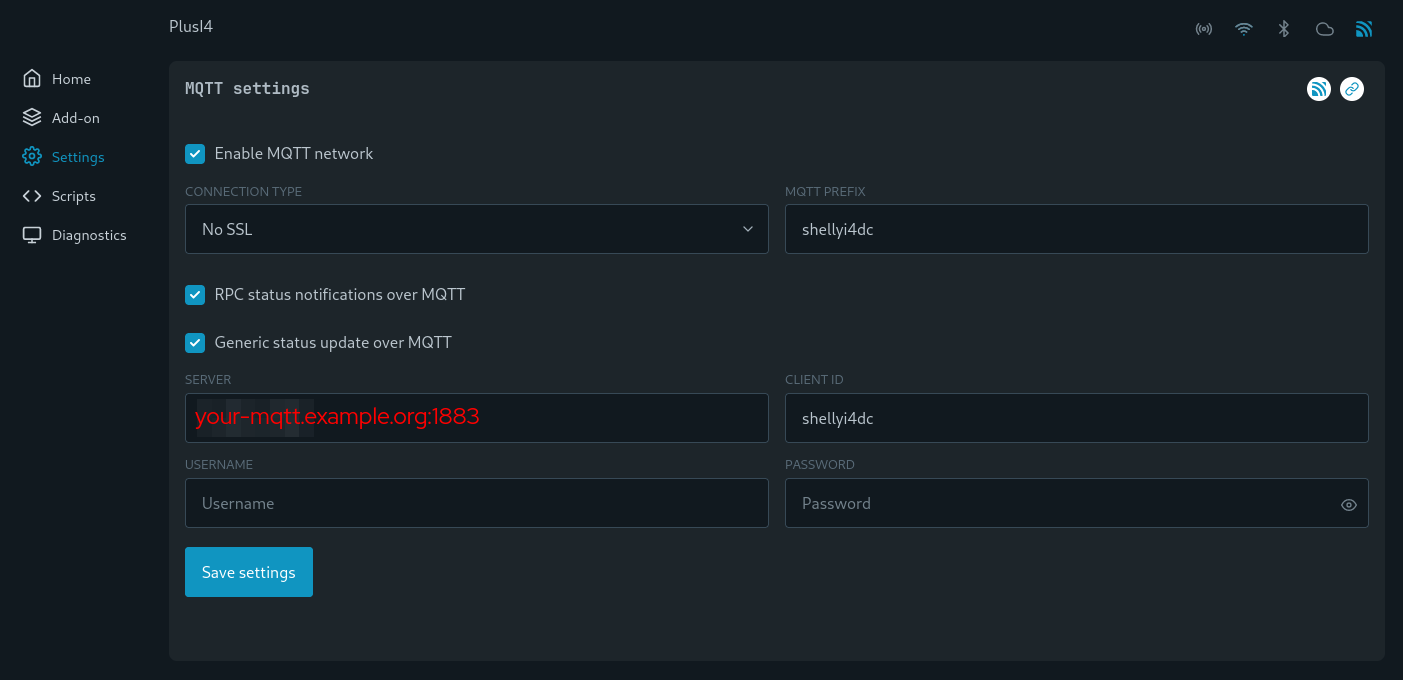
Shelly
Configure your device to send info to MQTT:
Telegraf + InfluxDB + Grafana
I used this docker-compose.yml file to start all those:
version: "3.8"

services:
  influxdb:
    image: influxdb:1.2
    restart: always
    network_mode: "host"
    volumes:
      - /opt/docker/container/mqtt-dashboard/influxdb/:/var/lib/influxdb

  telegraf:
    image: telegraf
    restart: always
    volumes:
      - /opt/docker/container/mqtt-dashboard/telegraf/telegraf.conf:/etc/telegraf/telegraf.conf:ro
    network_mode: "host"
    depends_on:
      - influxdb

  grafana:
    image: grafana/grafana
    restart: always
    network_mode: "host"
    volumes:
      - /opt/docker/container/mqtt-dashboard/grafana:/var/lib/grafana
    depends_on:
      - influxdb
Telegraf
The telegraf.conf makes sure to listen to all MQTT topics and send values to the local InfluxDB instance:
[[outputs.influxdb]]
  urls = ["http://localhost:8086"]

[[outputs.file]]
  files = ["stdout"]

[[inputs.mqtt_consumer]]
  servers = ["tcp://localhost:1883"]
  topics = [
    "#"
  ]
  data_format = "json"
I run a fairly old instance of InfluxDB. For some reason I couldn’t get InfluxDB to ingest json_v2 logs for more than a minute. Whoever achieved this, please comment!
Everything runs on the host interface so I point to localhost to reach services.
Grafana
On first connection to Grafana, you need to reset the password.
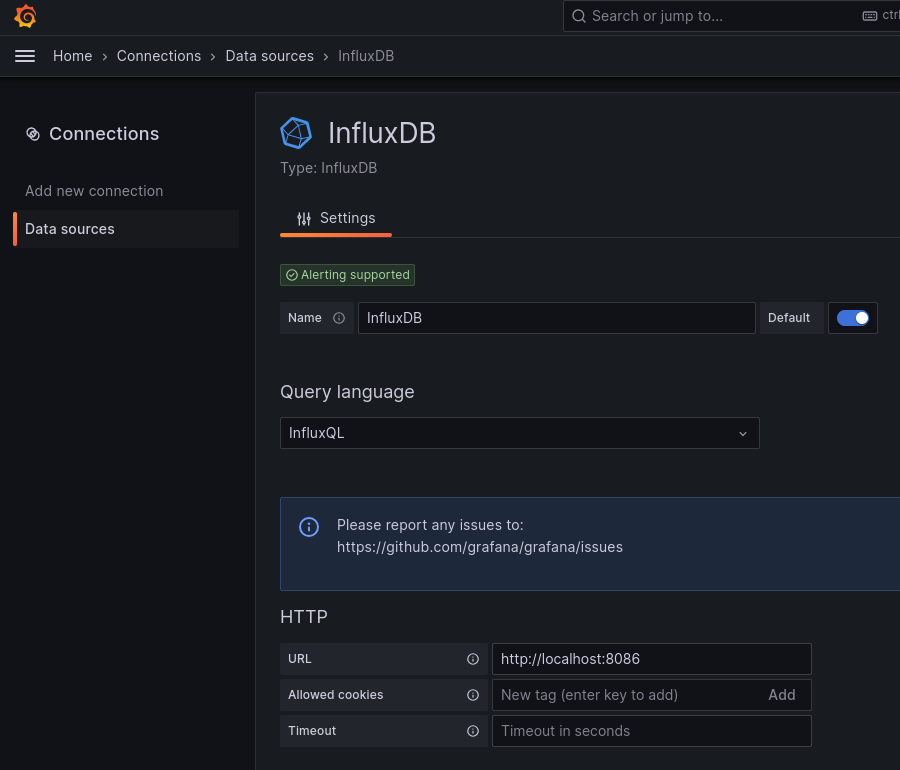
Add a data source pointing to InfluxDB:
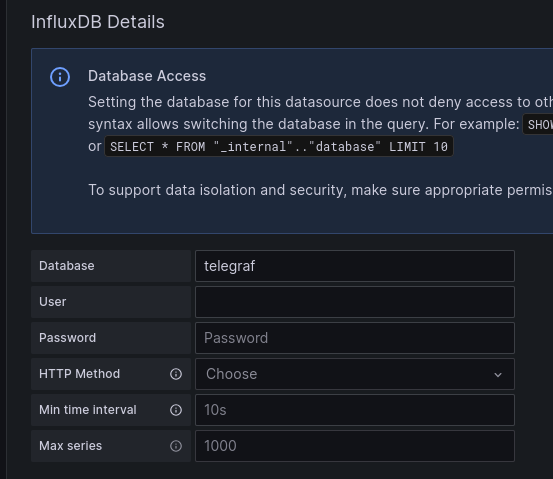
Make sure to point the data source to the telegraf database:
Create a new dashboard:
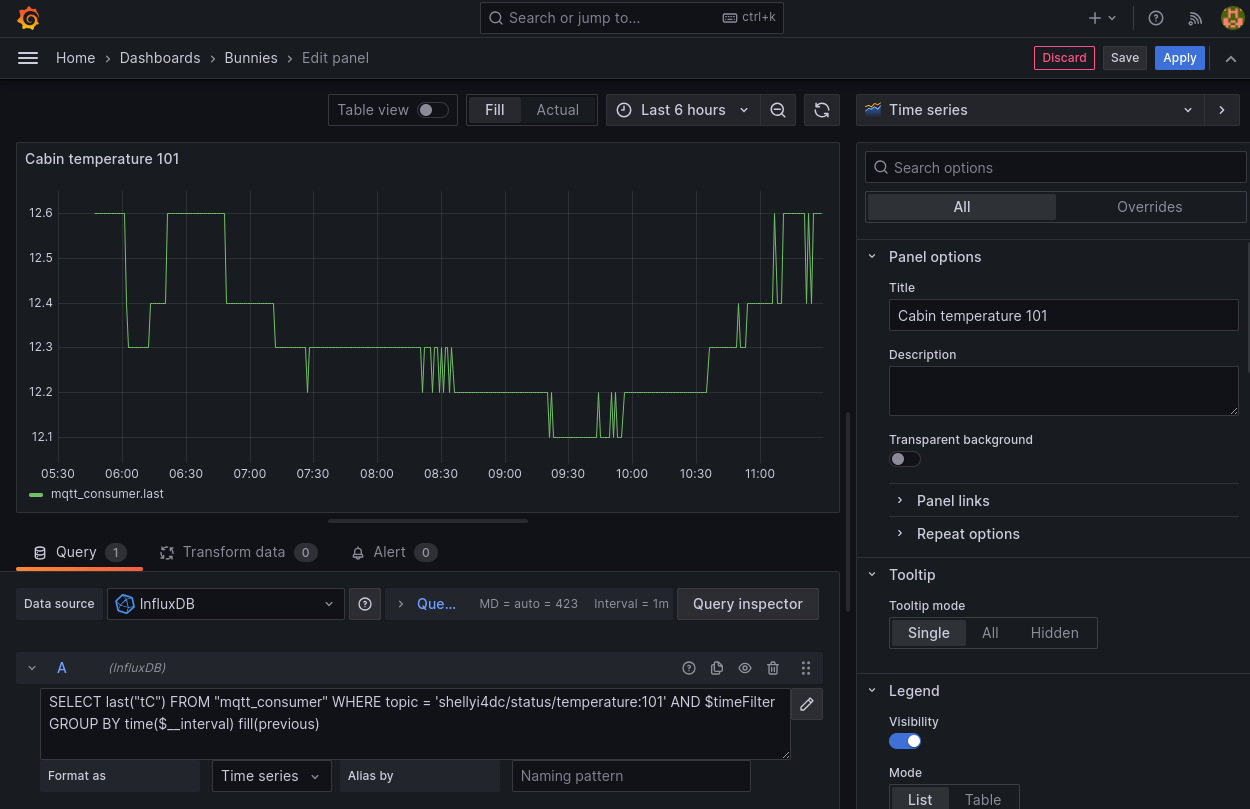
An example of query to graph the temperature of my probe:
SELECT last("tC") FROM "mqtt_consumer" WHERE topic = 'shellyi4dc/status/temperature:101' AND $timeFilter GROUP BY time($__interval) fill(previous)
Troubleshooting
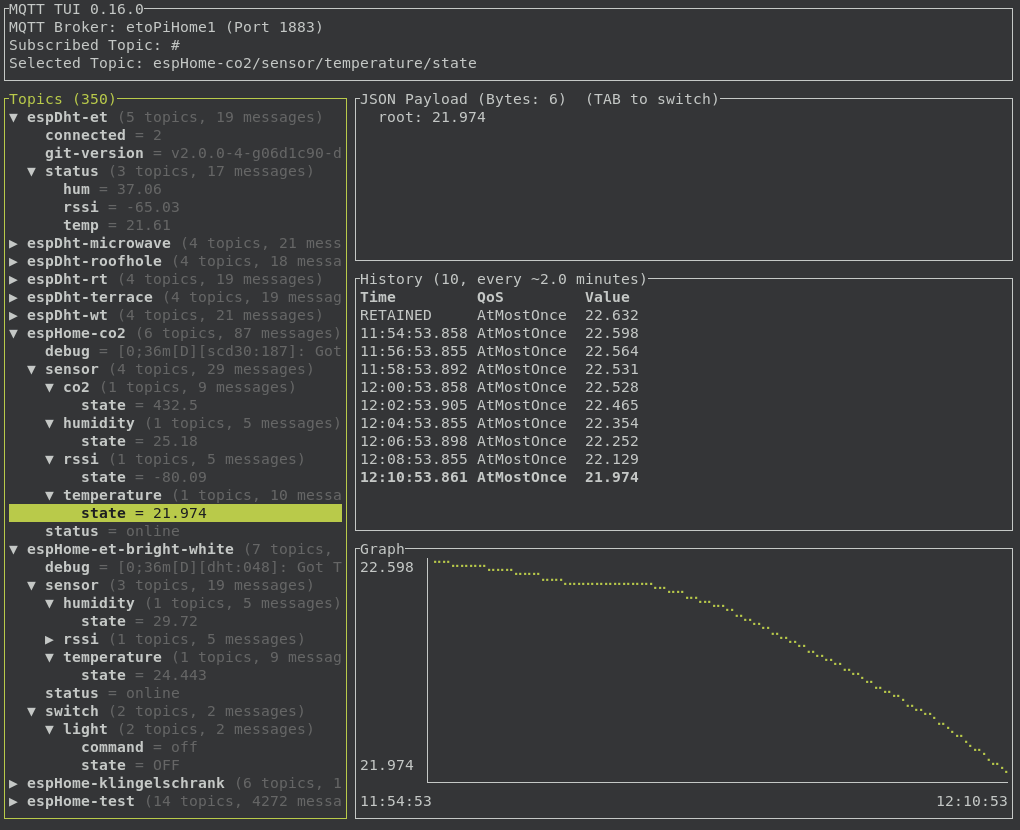
I used mqttui to confirm values were sent by the Shelly to MQTT.
Links
Heavily inspired from Handling IOT data with MQTT, Telegraf, InfluxDB and Grafana